Support the Timberjay by making a donation.

Cold comes with less frequency and intensity
Climate change is bringing many impacts, some that will likely bring profound effects in the future
REGIONAL— The North Country is getting much warmer, and that was apparent even before the region experienced its warmest “winter” on record this year. Yet, trying to explain the …
This item is available in full to subscribers.
Attention subscribers
To continue reading, you will need to either log in to your subscriber account, below, or purchase a new subscription.
Please log in to continue |
Cold comes with less frequency and intensity
Climate change is bringing many impacts, some that will likely bring profound effects in the future

REGIONAL— The North Country is getting much warmer, and that was apparent even before the region experienced its warmest “winter” on record this year. Yet, trying to explain the changing climate in a place that still experiences cold weather can be a challenge, even for those trained in talking about climate.
“This is the thing we’re wrestling with,” said state climatologist Dr. Kenny Blumenfeld. “We’ve been trying to figure out how to describe the situation we’re in. Is it that the cold doesn’t come as frequently or that it comes with the same frequency but isn’t as cold?”
The real answer, said Blumenfeld, is both: The region has seen a decline in both the frequency and the intensity of cold outbreaks.
That can be seen in the climatic benchmarks that climatologists look at during winter. Here in Minnesota, a minus-20-degree reading is considered a benchmark in southern Minnesota. A minus-30-degree reading is a benchmark in central Minnesota, and that increases to minus-40 in northern Minnesota. These benchmarks were never reached with frequency, but they were reached in most winters, sometimes on several occasions.
That’s no longer the case. “When we look at cold weather benchmarks being hit, the frequencies have dropped anywhere from 60-90 percent,” said Blumenfeld. “The cold weather stats for Minnesota this winter are embarrassing,” he added. “No station even hit minus-30.”
And the change isn’t just at the extremes. The warming has been across the board and it has been steady, notes Blumenfeld. “Since about 1950, the average January low in International Falls has warmed by 11 degrees,” he said.
The “icebox of the nation” appears to be on the fritz.
Data tells the story
Climate is undoubtedly a numbers game and as the weather data has come in over the past half century from recording stations throughout the state, and from around the world, they create a discernible portrait of a warming climate. The Minnesota Department of Natural Resource’s climatology office has created several interactive tools that allow the public to examine that weather data in a variety of forms, right down to individual counties or even watersheds. These tools help the public distinguish the “noise” of day-to-day weather from the longer-term trends that make up climate.
One of those tools, found at https://arcgis.dnr.state.mn.us/ewr/climatetrends/, allows users to graph climate trends for every watershed in the state going back to 1895. The trend line is universally warmer, both for average annual temperature and average seasonal temperatures. While average high temperatures have increased, it is minimum temperatures that have increased the most, which Blumenfeld said is a signal of the impact of the rise of heat-trapping gases in the atmosphere.
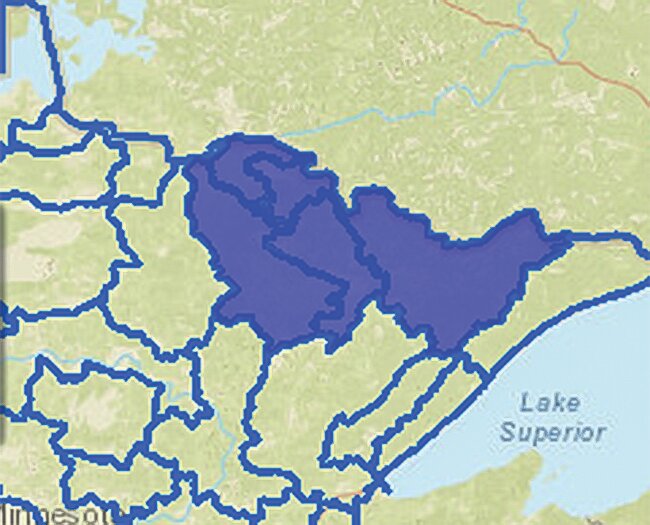
A combined analysis of the climate data from four area watersheds, including the Little Fork and Vermilion rivers, the Rainy River headwaters, and Rainy Lake, shows that since 1970, the average annual temperature in these local watersheds has increased from 36.37 degrees to 38.87 degrees, an increase of 2.5 degrees F, or 0.47 degrees per decade. Minimum temperatures have increased slightly faster, going from 25.24 degrees to 27.85 degrees today, an increase of 0.49 degrees per year.
But winter temperatures have increased much faster. The average winter temperature (Dec.-Feb.) has increased from 6.6 degrees F in 1970 to 10.6 degrees today, a rise of 0.75 degrees per decade. And overnight lows have risen even more dramatically, according to the data, going from minus-4.16 degrees F to plus-0.39 degrees F today. That’s an increase of 0.86 degrees per decade.
That trend appeared most pronounced earlier in the 1970-2023 period. Over the past 15-20 years, however, the trend line is largely flat, suggesting that the pace of warming may be slowing. That more recent trend line does not include the data from the 2023-24 winter.
As most climate models have projected, warming temperatures, particularly in winter, have led to more precipitation. Warmer air can carry more water vapor and that’s led to more precipitation in the North Country, even during the winter months, which are historically dry. Since 1970, the average winter precipitation (liquid equivalent) in the North Country has increased 50 percent, from 2.46 inches to 3.7 inches. That hasn’t always translated into more snow, however, as an increasing amount of winter precipitation in the region is now falling as rain.
That trend of increased precipitation does not appear in weather records for the summer months. In fact, the trend line has been toward drier summers than in the past. In 1970, summer (June-Aug.) precipitation averaged 12.3 inches, but that average has dropped to 10.39 inches since, a fact that may well be contributing to the higher frequency of summer drought and related wildfires.
Climate change signal intensifies
While there have long been variations in our weather, the early years of weather record-keeping in Minnesota failed to show any prominent warming trend. The biggest changes began right around 1970, according to Blumenfeld. “That’s widely seen as the year when things really started to happen globally,” he said. At that time, the atmospheric data showed the concentration of heat-trapping carbon dioxide at about 325 parts per million (ppm), a 16-percent increase over the pre-industrial concentration of approximately 280 ppm. Since then, the concentration of CO2 has increased to 422 ppm, or more than 50 percent, based on data recorded on Mauna Loa in Hawaii. That concentration has been increasing by about ten ppm every four to five years.
The impact of that additional CO2 plus other heat-trapping gases, like methane, is seen in places like International Falls on those cold clear January nights when the temperature used to fall a lot more than it does today. “That’s tied directly to greenhouse gases,” said Blumenfeld. “Heat escapes most in winter and at night, so the impact [of greenhouse gases] are the most pronounced then. That physically prevents it from getting as cold.”
While this winter’s record-setting warmth was attributable in part to a strong el Niño pattern in the Pacific Ocean, the impact of climate change was unmistakable and Blumenfeld said he won’t be surprised to see another winter that tops this one during his career.
“These are pretty solid trends that we’ve seen for multiple decades so it would be foolish to think we’re not going continue to see this trend,” he said. “It’s not like every winter is going to be like this. There will still be winters that still feel like winter but we may see winters even warmer than the one we just observed.”
That could have profound changes to the North Country environment. A recent study published in the journal Nature found that areas that reach an average winter temperature of 17 degrees F reach a tipping point in which long-term snowpack disappears. That was clearly seen in the region this year, when the average winter temperature topped 20 degrees at virtually every reporting station in Minnesota. With temperatures that warm, we saw snow cover only lasted a few weeks at most, as opposed to several months as has long been the case in northern Minnesota.
At the current pace of warming, the winter we just experienced could become the norm in the region by the end of the century. If the trend line continues to steepen, that day could come much sooner.


